FFT, power spectral density – PSD and spectrogram are common tools for vibration analysis. MatDeck has various functionalities for all these tools which are used for vibration analysis.
FFT
The result of FFT analysis is the acceleration/vibration of the amplitude as a function of the frequency, which allows us to perform analysis in the frequency domain (or spectrum) to gain a deeper understanding of our vibration profile. Most vibration analysis is typically done within the frequency domain. The number of discrete frequencies that are calculated using fft () as part of a Fourier transform is directly proportional to the number of samples in the original signal. However, the FFT analysis can be calculated for a smaller number of frequency points as well. You have to make a compromise between spectrum precision and the number of operations.
Power spectral density – PSD
We can determine the dominant frequency components by using PSD analysis. However, again the time domain information is unfortunately lost. Welch’s method for estimating the power spectrum is carried out by dividing the time signal into successive blocks, forming the periodogram for each block, and then averaging them. MatDeck contains a function powspectwelch() specifically crafted for this purpose.
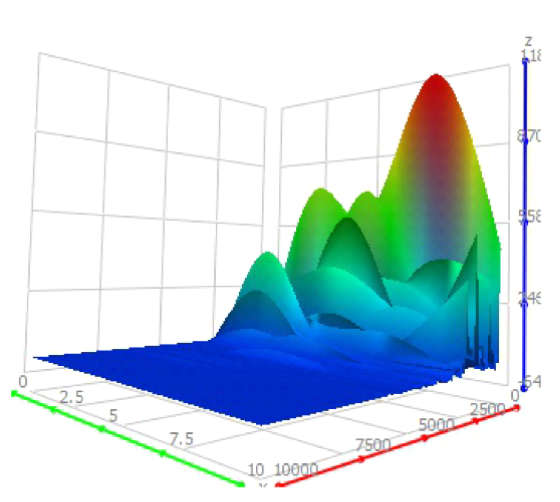
Spectrogram
Whenever the vibration frequency changes with time, we need a spectrogram. A spectrogram works by breaking the time domain data into a series of chunks and taking the periodograms of all these time periods. These series of periodograms are then overlapped to visualize how both the amplitude and frequency of the vibration signal changes with time. We need three dimensional graphs to show the spectrogram versus time and frequency. MatDeck contains a function spectrogram () which shows the results in a 3D graph.
There are several real world examples that illustrate MatDeck’s capabilities for vibration testing and analysis: